Overview
This section explains how to set up the observability solutions and perform management tasks for WSO2 Micro Integrator.
Observability
Observability can be viewed as a superset of monitoring where monitoring is enriched with capabilities to perform debugging and profiling through rich context, log analysis, correlation, and tracing. Modern day observability resides on three pillars of logs, metrics, and tracing. Modern businesses require observability systems to self-sufficiently emit their current state(overview), generate alerts for any abnormalities detected to proactively identify failures, and to provide information to find the root causes of a system failure.
Observability solutions
WSO2 Micro Integrator offers an observability solution based on Prometheus, Loki, Jaeger and Grafana. You can also monitor basic observability data sources such as metrics, logs, and traces.
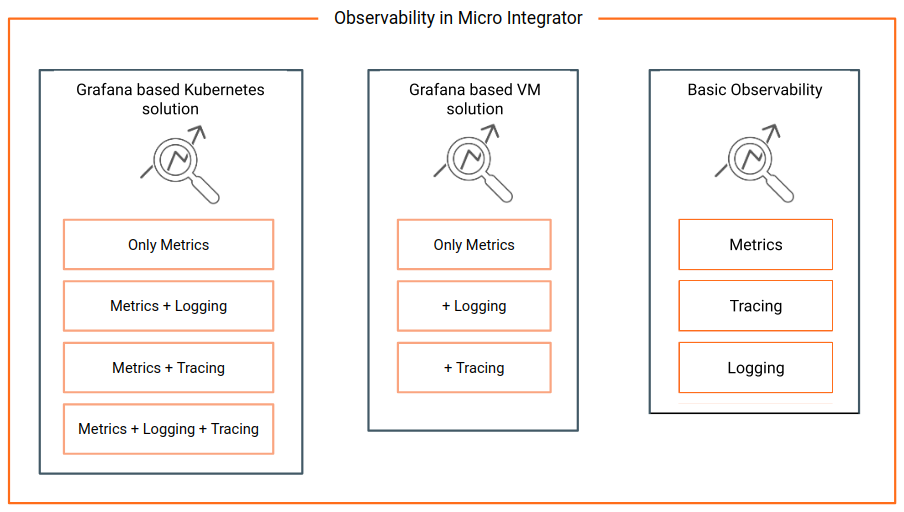
The Grafana based observability solution and basic observability solution are suitable for the following combination of operations.
| Observability solution | Operations | Description |
|---|---|---|
| Grafana based Kubernetes solution |
|
The default Grafana based Kubernetes solution comes with metrics enabled. You can also configure logging and tracing in combination with this. This solution is ideal if you want a complete solution to observability and you already have Prometheus, Grafana, and Jaeger as your in-house monitoring and observability tools. |
| Grafana based VM deployment |
|
The default Grafana based VM solution comes with metrics enabled. You can additionally set up logging or tracing separatly as part of this solution later. This solution is ideal if you want a complete solution to observability, but you need to set this up on a VM. Ideally you would already have Prometheus, Grafana, and Jaeger as your in-house monitoring and observability tools. |
| Basic Observability |
|
This solution allows you to monitor the requests and the responses that correspond to a specific API call, monitor your application's usage, enable tracing and monitor WSO2 Micro Integrator via the JConsole tool. This is a more simpler solution. |
-
For instructions to set up the above observability solutions, see Setting up Grafana based Observability on a VM or Setting up Grafana based Observability on Kubernetes
-
For more information on how to use the Grafana based solution, see Viewing Grafana Dashboard.
-
For more information on monitoring basic observability data sources, see Monitoring Metrics, Monitoring Logs, and Monitoring Traces.
Built-in Tools
You can monitor and manage various artifacts that you have deployed. The following are the options that enable you to do this.
- Micro Integrator Dashboard: Allows you to perform administration tasks related to your Micro Integrator deployment.
- Managing Integrations with apictl: Allows you to perform various management and administration tasks from the command line.
- Using the Management API: The Micro Integrator CLI and the Micro Integrator dashboard communicate with this service to obtain administrative information of the server instance and to perform various administration tasks. If you are not using the dashboard or the CLI, you can directly access the resources of the management API.
Integration with external tools
You can integrate with external tools to do the following:
Monitoring Metrics