Micro Integrator Observability Overview
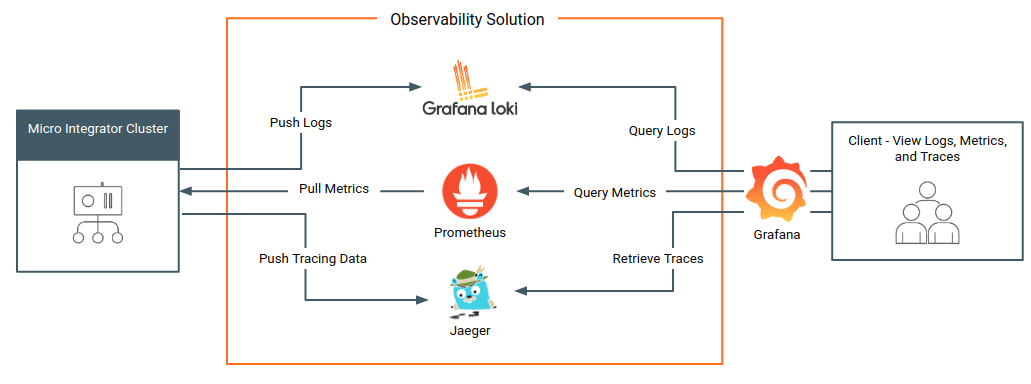
The following diagram depicts the complete Grafana based observability solution for your Micro Integrator deployment, which includes metrics monitoring, log monitoring, and message tracing capabilities.
Minimum Grafana based observability
The basic deployment offers you metrics capabilities. You can set up the basic deployment with only Prometheus and Grafana to view and explore with the available Prometheus metrics.
Grafana based observability add ons
You can also set up different flavors of the observability solution depending on your requirement.
Log processing add on
Once you set up the basic deployment, you can integrate log-processing capabilities. To use this, you need to install Fluent-Bit as the logging agent and Grafana Loki as the log aggregator.
Message tracing add on
Once you set up the basic deployment, you can integrate message tracing capabilities. To use this you need to install Jaeger.
Observability solutions
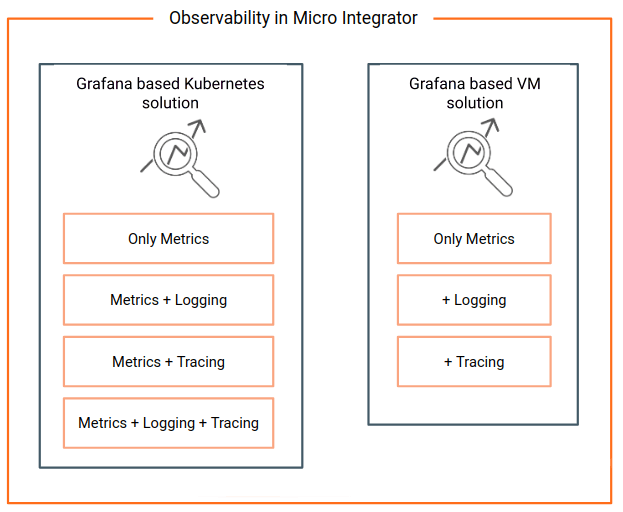
There are two Grafana based observability solutions for the Micro Integrator; The Kubernetes based deployment and the VM based deployment.
These solutions are suitable for the following combination of operations.
| Observability solution | Operations | Description |
|---|---|---|
| Grafana based Kubernetes solution |
|
|
| Grafana based VM deployment |
|
|
Technologies
The Grafana based observability solution is based on proven projects from the Cloud Native Computing Foundation, which makes the solution cloud native and future proof. Following are the technologies used in the current solution:
| Feature | Technology |
|---|---|
| Metrics | Prometheus |
| Visualization | Grafana |
| Logging | Log4j2, Fluent-Bit, and Grafana Loki |
| Tracing | Jaeger |


